Build a dashboard to visualize data
In this step, we will visualize some of the data we have been modeling in a dashboard using Evidence connected to our model assets.
1. Add the Evidence project
First, we will clone an Evidence project that is already configured to work with the data we have modeled with dbt:
git clone --depth=1 https://github.com/dagster-io/jaffle-dashboard.git dashboard && rm -rf dashboard/.git
There will now be a directory dashboard within the root of the project.
.
├── pyproject.toml
├── dashboard # Evidence project
├── src
├── tests
├── transform
└── uv.lock
Change into that directory and install the necessary packages with npm:
cd dashboard && npm install
2. Define the Evidence Component
Next, we will need to install Dagster's Evidence integration:
uv pip install dagster-evidence
Now we can scaffold Evidence with dg:
dg scaffold defs dagster_evidence.EvidenceProject dashboard
This will add the directory dashboard to the etl_tutorial module:
src
└── etl_tutorial
    └── defs
        └── dashboard
            └── defs.yaml
3. Configure the Evidence defs.yaml
Unlike our other components which generated individual assets for each model in our project. The Evidence component will register a single asset for the entire Evidence deployment.
However we can still configure our Evidence component to be dependent on multiple upstream assets.
type: dagster_evidence.EvidenceProject

attributes:
  project_path: ../../../../dashboard
  asset:
    key: dashboard
    deps:
      - target/main/orders
      - target/main/customers
  deploy_command: 'echo "Dashboard built at $EVIDENCE_BUILD_PATH"'
4. Execute the Evidence asset
With the Evidence component configured, our assets graph should look like this:
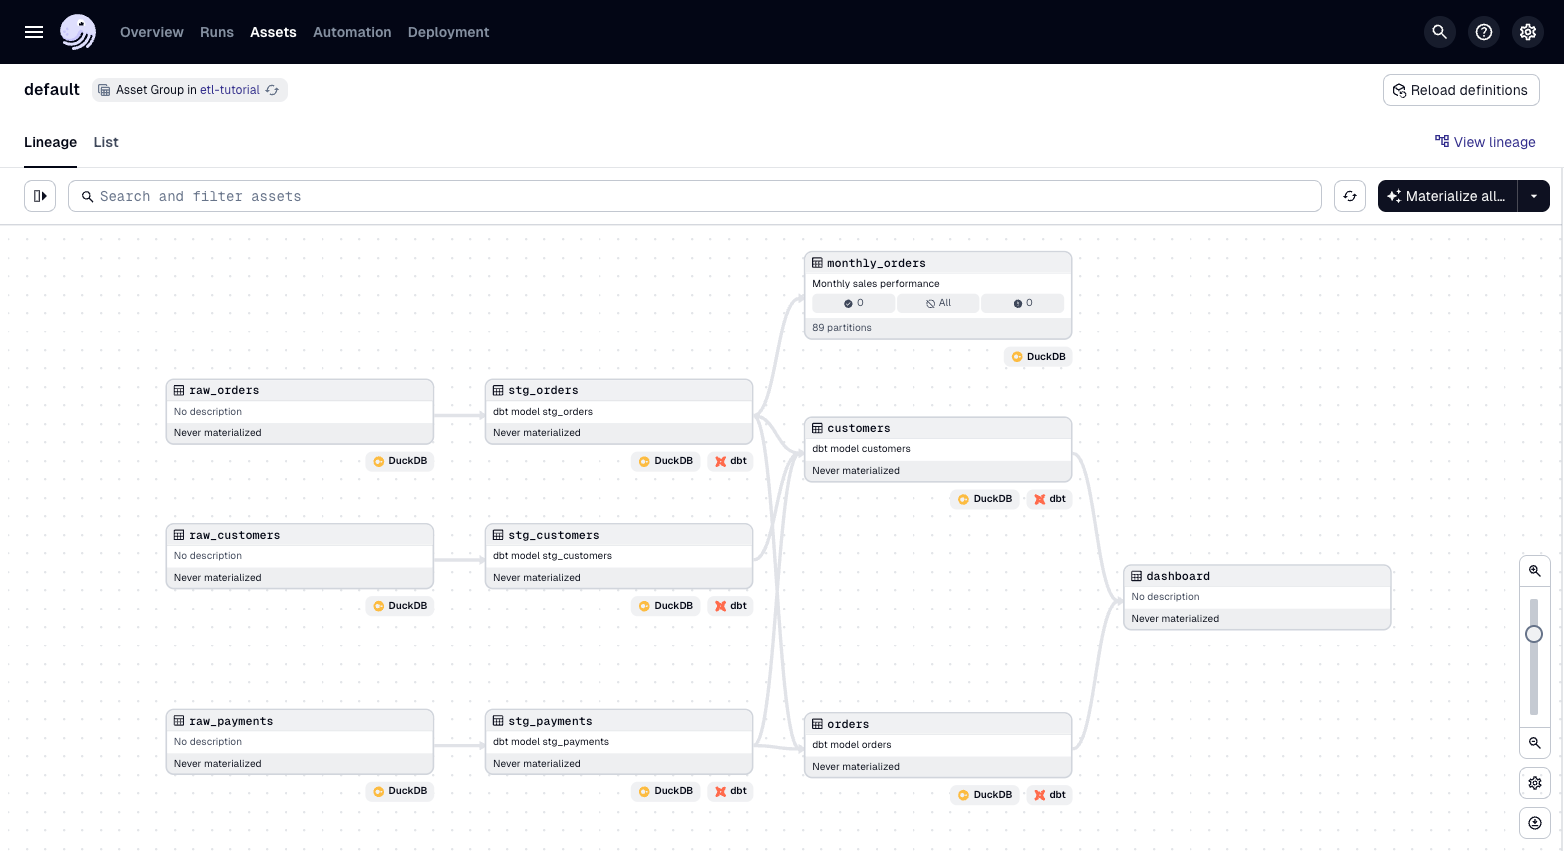
Execute the downstream dashboard asset which will build our Evidence dashboards. You can now run Evidence:
cd dashboard/build && python -m http.server
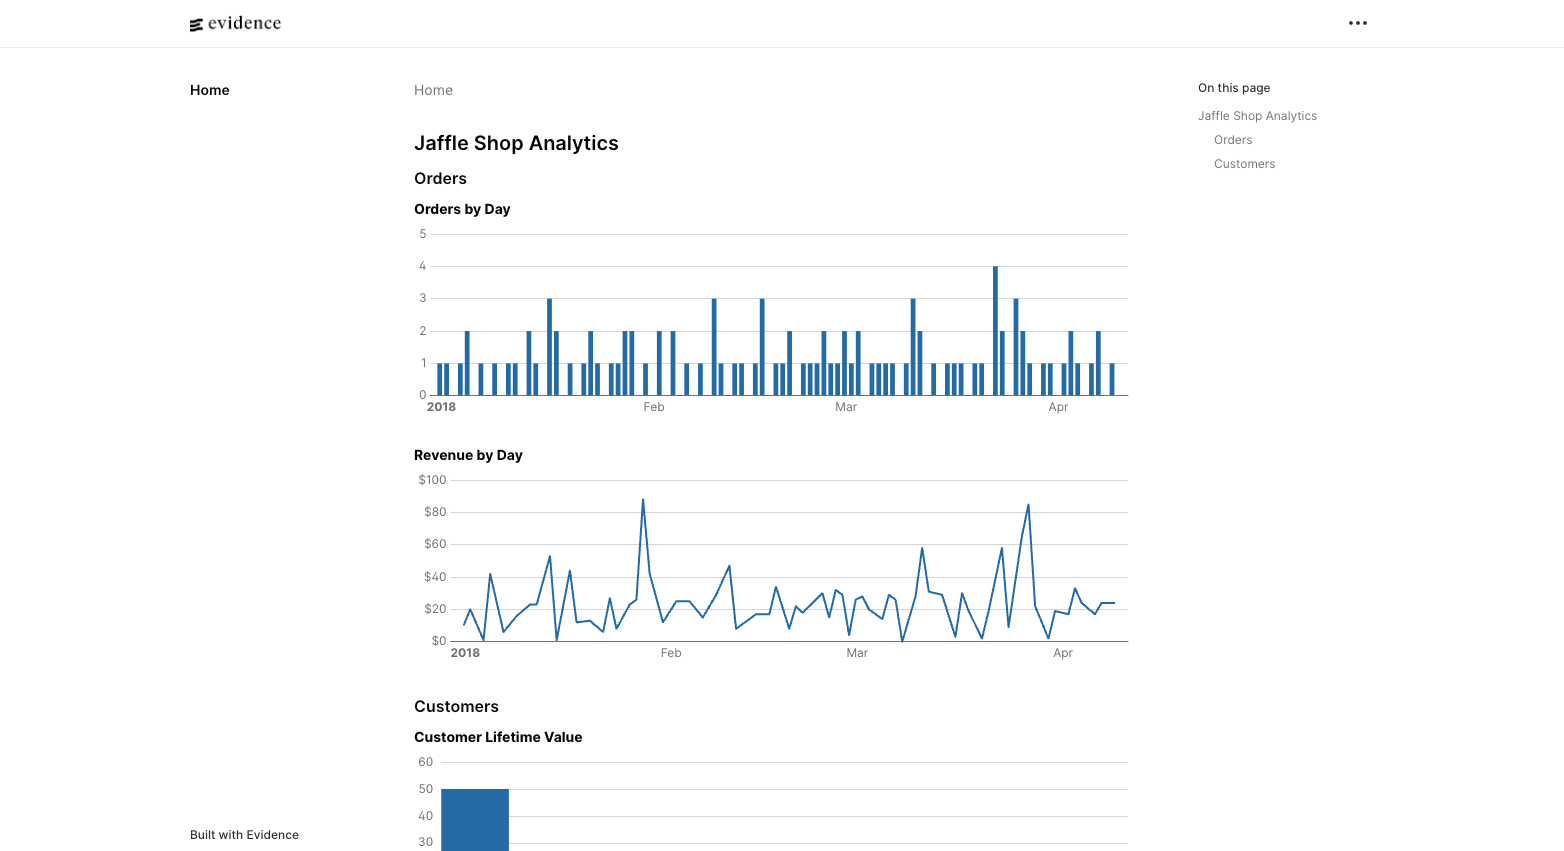
You should see a dashboard like the following at http://localhost:8000/:
Summary
Here is the final structure of our etl_tutorial project:
src
└── etl_tutorial
    ├── __init__.py
    ├── definitions.py
    └── defs
        ├── __init__.py
        ├── assets.py
        ├── dashboard
        │   └── defs.yaml
        ├── resources.py
        └── transform
            └── defs.yaml
We have now built a fully functional, end-to-end data platform that handles everything from data ingestion to modeling and visualization.
Recommended next steps
- Join our Slack community.
- Continue learning with Dagster University courses.
- Start a free trial of Dagster+ for your own project.